Your 60/40 May Be Broken: Here's Why
Posted:Rethinking Risk for 2020 & Beyond
The classic 60/40 portfolio—the strategy of dividing assets between stocks and bonds, respectively—has long been held as a gold standard in risk adjusted returns. The core premise is simple: allocate 60% of the portfolio towards long-term growth, and 40% to fixed-income to moderate stock market volatility. Through numerous market cycles, history has indicated this framework to be highly efficient at budgeting risk, besting the result of Ivy League endowments and hedge funds alike.
The optimal 60/40 portfolio for 2019 called for a complete 1 for 1 substitution of fixed income with gold exposure—an outright replacement, dollar for dollar.
This success notwithstanding, what if a straightforward fix could improve investor outcomes yet further still? The mathematical reality is that the venerable 60/40 was a sub-optimal investment in 2019—simply adding gold, and in any quantity, would have immediately improved portfolio efficiency. Even during a historic year for bonds, substituting gold for fixed income exposure in 2019, in any amount, automatically constructed a superior 60/40 portfolio. While sacrilegious to the extreme, these insights merely combine the 70 year old lessons of Modern Portfolio Theory with gold’s ability to buffet market volatility.
A New Frontier of Efficiency
The diagram below displays the efficient frontier of adding gold in graduated amounts to a 60/40 portfolio, with consistent and continuous gains to further gold allocations. The chart depicts mean annualized returns on the vertical axis against portfolio volatility (standard deviation of returns) on the horizontal axis; consequently points towards the upper left corner are the most attractive and towards the lower right the least. Significantly, the blue line shows the range of attainable efficient portfolios from combining the 3-month treasury with the optimal stock/bond/gold mix the line intersects (solid blue is gold-backed 60/40, dashed blue is its traditional counterpart).
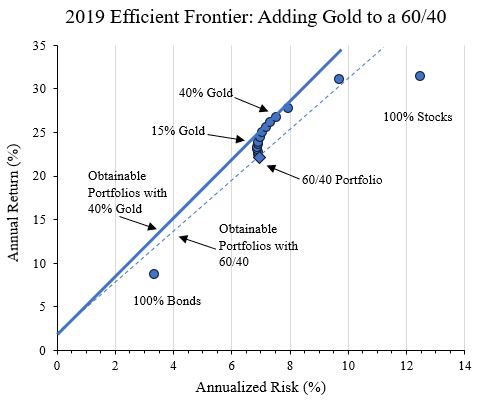
Notes: Time period under analysis is 12/31/2018 to 12/31/2019. Performance of stocks is represented by the S&P 500 Index, and 60/40 is allocated between 60% of the former and 40% of the Bloomberg Aggregate Bond Index. Past performance is not guarantee of future returns.
Source: Bloomberg data and GraniteShares Research.
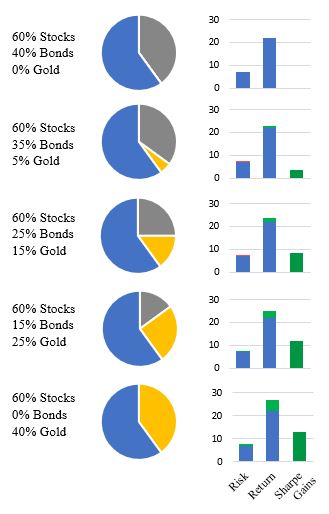
The benefits to adding gold to a 60/40 portfolio at the expense of fixed income exposure were noticeable with allocations as small as 1% gold. As tabulated in the chart below, each successive addition of gold to the portfolio bolstered not only total returns, but more impressively, risk adjusted return. In fact, the strategy that absolutely minimized volatility held 10% gold! Perhaps the most resonating finding of all, however, is that the optimal gold allocation in a 60/40 construct occurred not at 15%, 20%, or even 30%, but an astounding 40%. The optimal 60/40 portfolio for 2019 called for a complete 1 for 1 substitution of fixed income with gold exposure—an outright replacement, dollar for dollar. This ability to diversify market risk is one of the key reasons underpinning gold’s role in the portfolio.
| Portfolio | Risk (%) | Return (%) | Sharpe Ratio |
|---|---|---|---|
| 60/40 | 6.94 | 22.18 | 2.94 |
| Gold 2.5% | 6.91 | 22.46 | 2.99 |
| Gold 5% | 6.90 | 22.75 | 3.04 |
| Gold 10% | 6.89 | 23.31 | 3.12 |
| Gold 15% | 6.92 | 23.88 | 3.19 |
| Gold 20% | 6.98 | 24.45 | 3.25 |
| Gold 25% | 7.07 | 25.01 | 3.29 |
| Gold 30% | 7.19 | 25.57 | 3.31 |
| Gold 35% | 7.34 | 26.14 | 3.32 |
| Gold 40% | 7.52 | 26.70 | 3.32 |
Such an empirical finding may shatter the received wisdom on portfolio construction and asset allocation. Far from being relegated to a token exposure in the low single digits, gold significantly enhanced portfolios at far larger allocations in 2019. For instance, transitioning to the optimal 40% gold allocation increased portfolio returns by 4.52% over the base 60/40 for the cost of only 0.58% in additional risk.
The Sharper Image
To illustrate the risk/return gain of this trade off, the gold-backed 60/40 improved the base model’s already impressive Sharpe ratio of 2.94 up to 3.32, a 13% improvement. The Sharpe ratio is perhaps the best measure of a portfolio’s risk efficiency, breaking down how much return can be achieved for each unit of additional risk deployed in the market. In fact, the Sharpe ratio directly measures the slope of the blue lines in the efficient frontier diagram above, and is one of the central insights emanating from Modern Portfolio Theory. As a basic rule of thumb, a Sharpe ratio above 2.00 is considered attractive.
Related: Correlations and the Art of a Terrible Tango
An import caveat in portfolio analysis is that simply because an investment decision is optimal does not mean it is advisable. This distinction is important, as ultimately model portfolios need to be adapted to meet the practical needs of human investors. Nonetheless, even more modest gold holdings captured significant portions of the optimal gains. For instance, a 25% gold allocation still achieved 89% of the optimized risk enhancement effect, and a 20% allocation 75% of the efficiency improvements.
Which 60/40 Would You Choose?
If bonds at their best cannot match the diversifying prowess of gold, it may time to reexamine the basic building blocks of portfolio in light of mathematical realities.
As illustrated in the model portfolios above, the substitution of gold for fixed income was not simply an academic exercise in 2019; this shift to gold produced materially significant gains. Compared to the traditional 60/40, the optimized gold exposure yielded 259 basis points greater performance at an equivalent level of risk, or conversely, 79 basis points less risk at an equivalent level of performance. Moreover, at straight equity levels of performance, switching to a gold-backed 60/40 offered an additional 48% further risk reduction effect compared to diversifying to a regular 60/40 in the first place.
A Case for the 60/-40 Portfolio
These striking portfolio enhancements achieved in 2019 are not a stand-alone occurrence, but instead are reflective of gold’s capability as a diversifying asset. In the past 15 years since 2005, the optimized 60/40 portfolio allocated 35% to gold and yielded similar benefits to those achieved by gold in 2019. Extending this analysis further, even granting 5% of assets to gold had an 80% chance of yielding an improved or at very least equal Sharpe ratio to a conventional 60/40, all while adding an independent driver of returns. Critically, this twenty-year period covered multiple market cycles and interest rate regimes, including two 50% down draws in equities and a federal funds rate that fully spanned 0 to 6 percent.
Read More: Madness in the Metals: What Will 2020 Bring?
After examining this quantitative history, the question that begs asking emerges: why is gold mythologized as an investment instead of receiving the detailed and statistical examination of any other asset class, fixed income in particular? Since gold first floated from the dollar in 1971, the asset has outperformed U.S. fixed income represented by the Agg with annualized returns of 8.2% vs. 7.3%. Faced with this record, why are bonds granted a near automatic allocation in model portfolios, a baseline of 40%, yet gold encounters bias-tinged scrutiny?
In an archetypal mismatch between human emotion and data driven analytics, investors have historically confused the factors that contribute to success in a portfolio—managing correlations. In 2019, higher total and risk adjusted returns were attained via actively shorting fixed income 40% so as to further allocated to gold, the classic 60/–40. This positioning is decidedly unorthodox, and yet it resulted in superior risk efficiency in 2019 with a Sharpe ratio of 3.06 versus 2.94 of the default 60/40. Moreover, this relationship was not fleeting, but extended over the last 15, 20 years. The immutable question remains—why does the bias for diversifying with bonds persist when the hard data points to gold’s potential?
Diversifying Thought on Diversification
Despite this extensive history, 2019 on a standalone basis is an instructive test case, as illustrates two key realities in quantitative finance. Foremost, with three cuts by the Fed giving rise the to the 8.9% return on the Agg, the best in 17 years, even unremarkable returns for gold delivered superior returns and risk control. The second, and perhaps more subtle point, is that even with equities returning in excess of 31% on the year, allocating to a non-correlating asset in the shape of gold still produced substantive improvements to risk efficiency.
Once more, managing portfolios all boils down to managing correlations. Far from obsolete, gold’s zero correlation to stock market performance has repeated demonstrated its value, especially vis à vis fixed income. If bonds at their best cannot match the diversifying prowess of gold, it may time to reexamine the basic building blocks of portfolio in light of mathematical realities. It appears the traditional 60/40 portfolio is perhaps broken, but not for the reasons conventionally presumed.
Past performance is not a guarantee of future returns. One cannot directly invest in an index.
Diversification does not assure a profit or protect against loss. The assets referenced are not a recommendation or solicitation to buy, hold or sell. There are no guarantees that a strategy of holding or nor holding certain securities will produce favorable results.
